Tutorial - Integration of CITE-seq and CODEX Protein Data
This tutorial describes how to use STvEA to integrate CITE-seq and CODEX protein data.
Cellar supports CITE-seq data. CITE-seq measures the epitome and transcriptome levels at the single cell level. To upload a CITE-seq dataset to Cellar, the data must be in AnnData format, with adata.X corresponding to the mRNA expression matrix and adata.obsm['proteins'] corresponding to the protein expression matrix. The names of the proteins must be stored under adata.uns['proteins'].
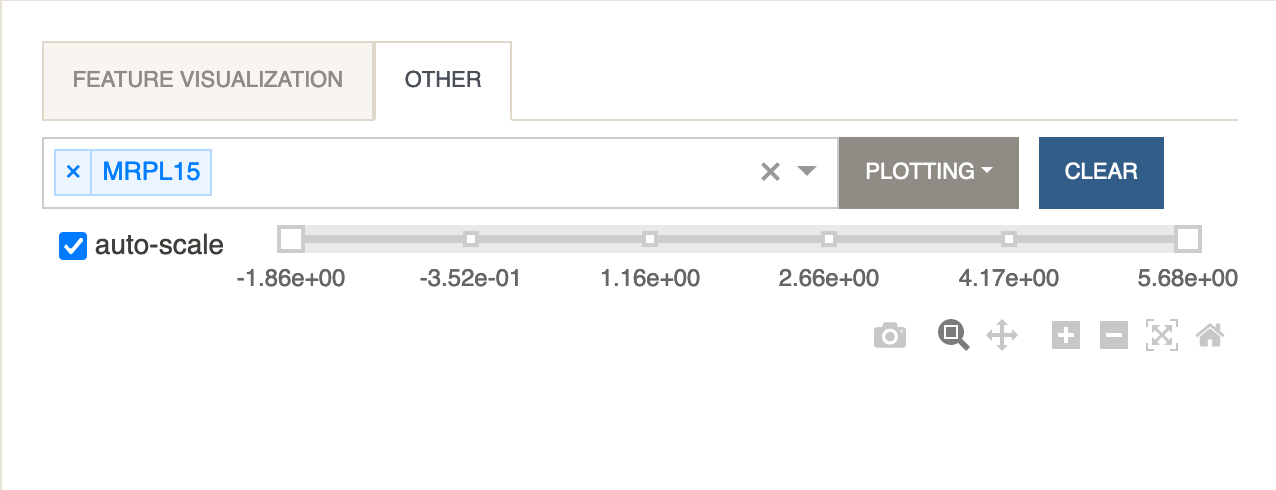
The expression levels of a protein can be visualized by selecting it from the Other Features tab under the Feature Visualization panel.
The integration of CITE-seq and CODEX protein data is performed by using the STvEA package which uses an anchor correction method to map features between the two.
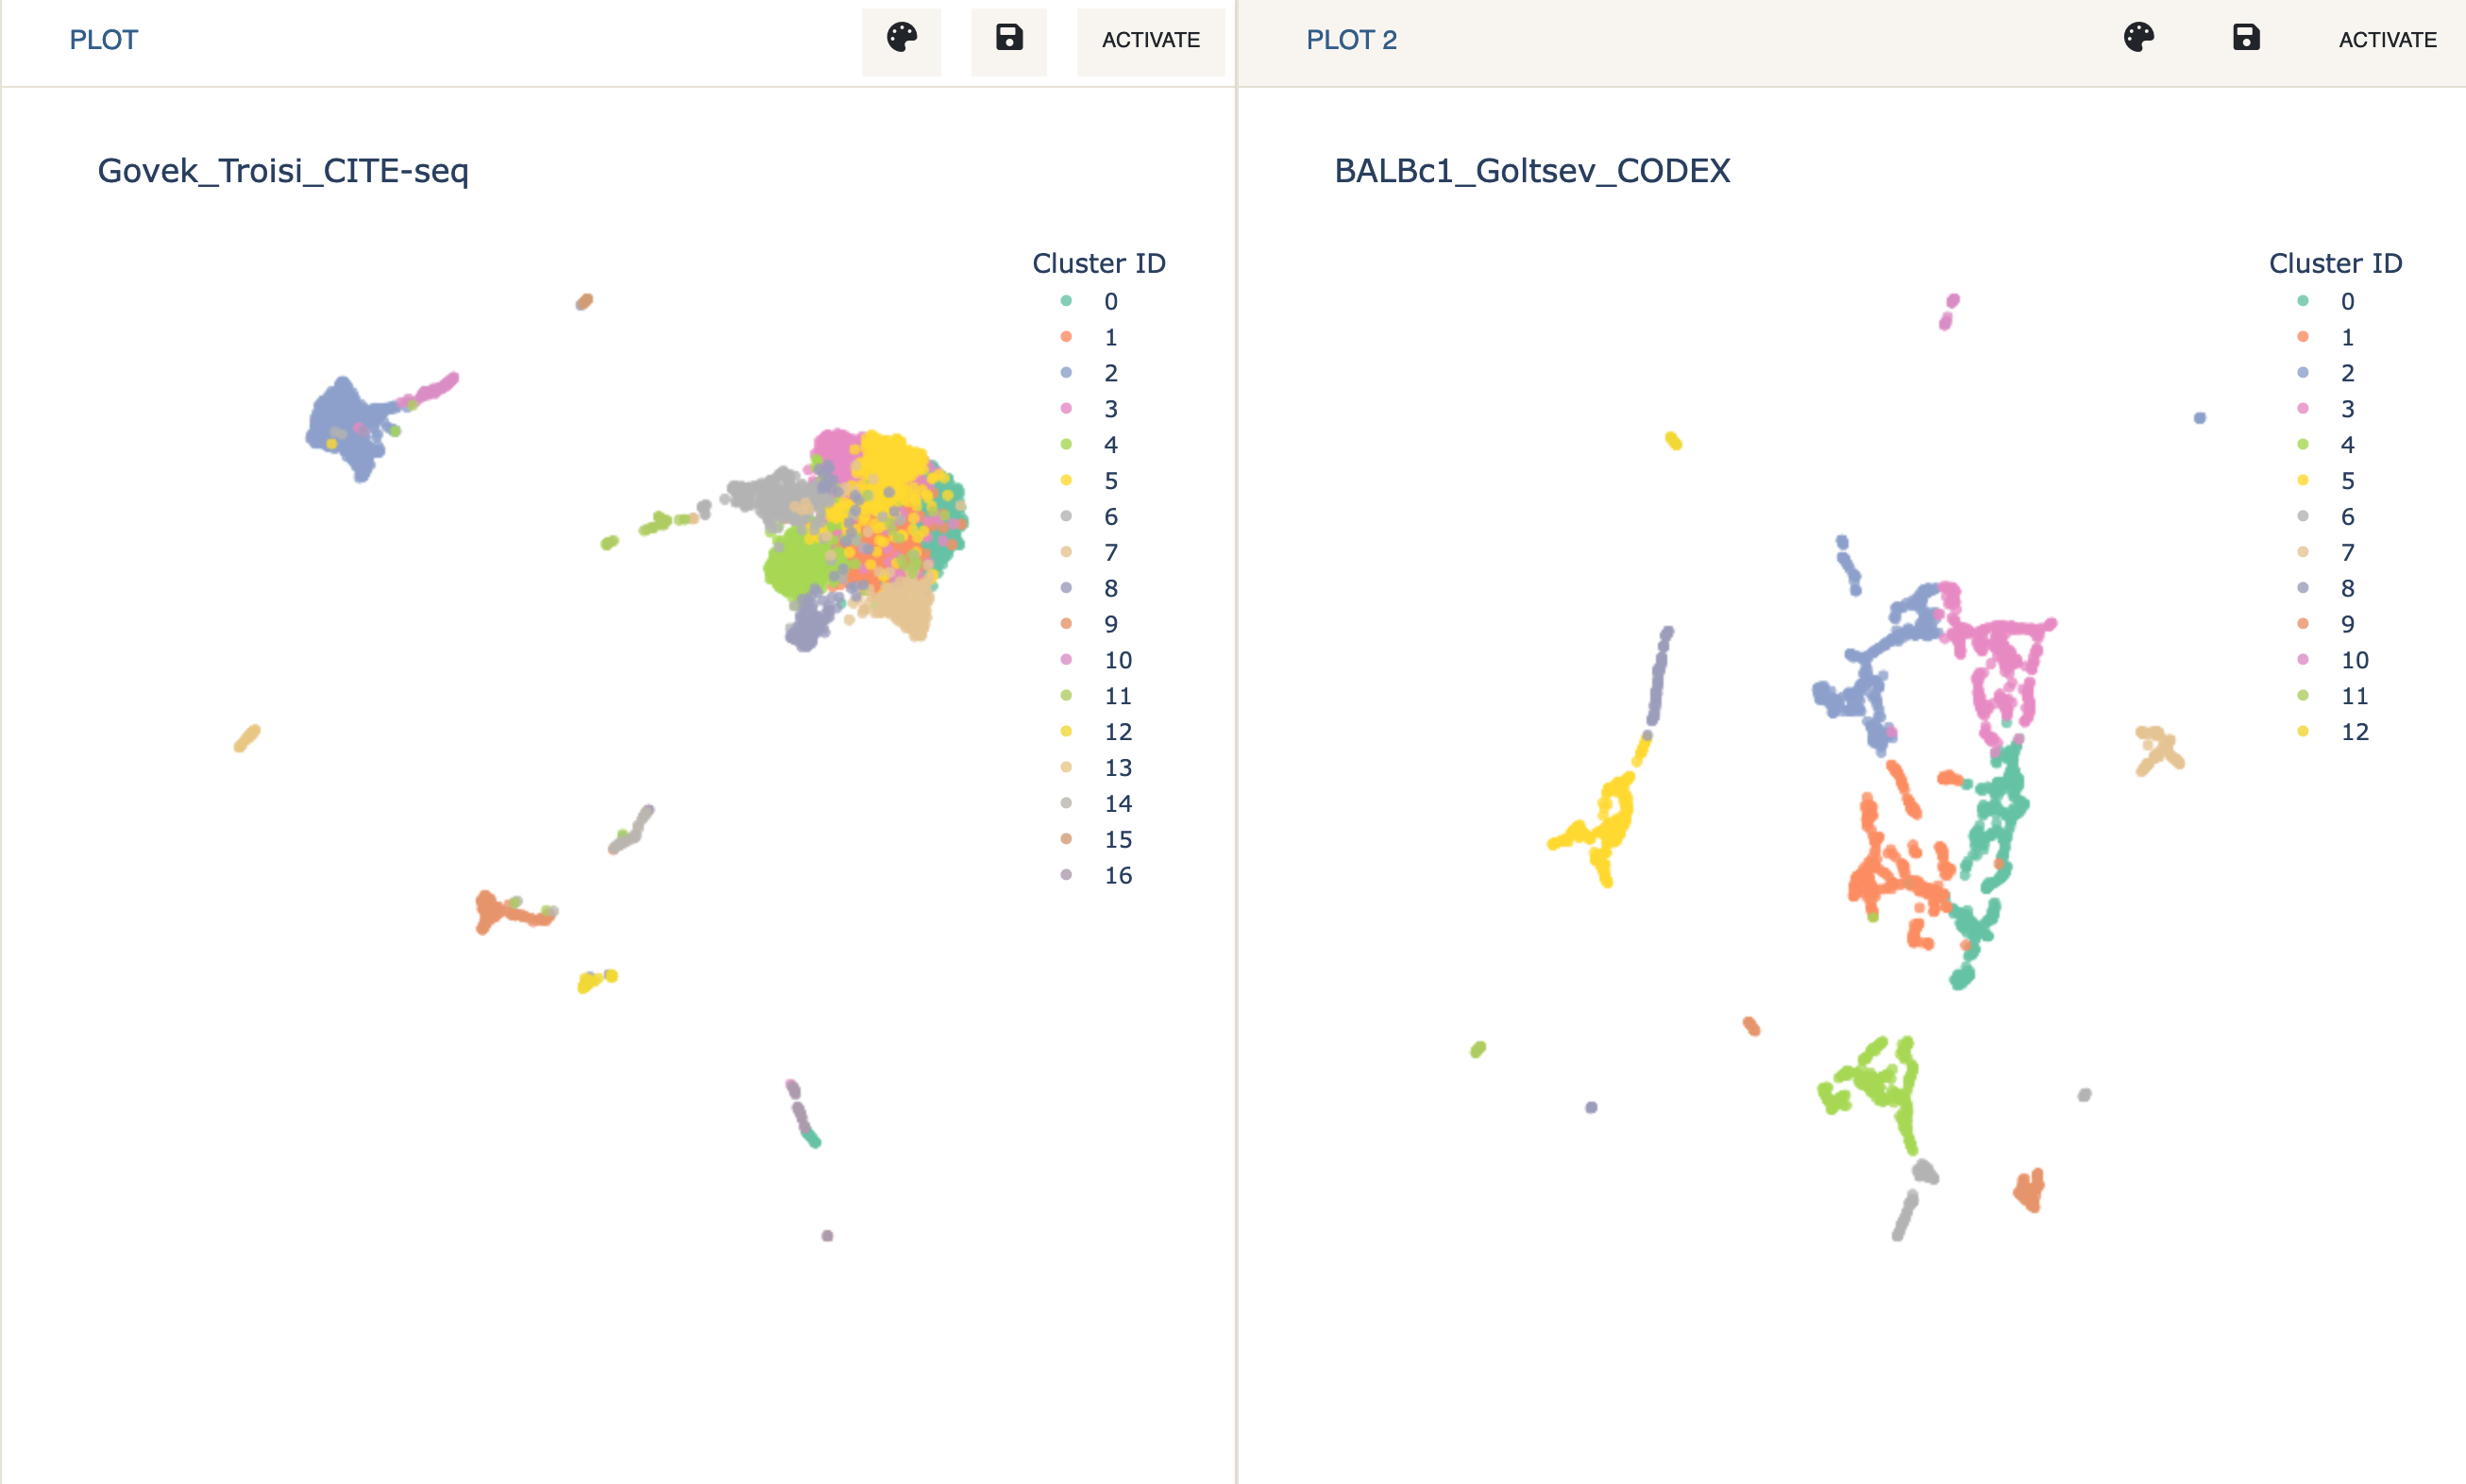
We will be using two datasets. The CITE-seq dataset we use consists of mRNA and protein expression data from mice and the CODEX dataset profiles the protein expression of tissue sections from 3 normal BALBc mice. To speed up calculations, we limit the analysis to only the first 3000 cells of the CODEX dataset.
- Load the two datasets in Dual Mode just as described in the Joint Analysis & Label Transfer tutorial (for CITE-seq load
Govek_Troisi_CITE-seq, and for CODEX loadBALBc1_Goltsev_CODEX_3k).

To perform the integration, first make sure the CODEX dataset is active.
-
Under the
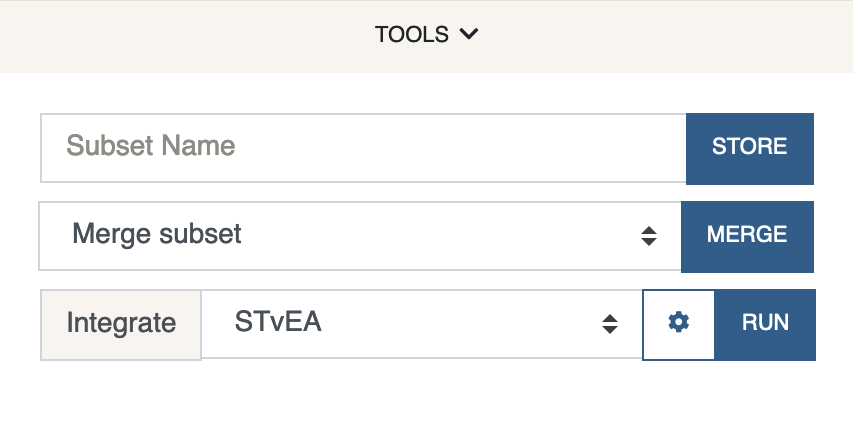
Toolsmenu, select STvEA next toIntegrateand clickRun.
By default, we clean both datasets since STvEA works best if the expression values are scaled to be in the (0, 1) interval.
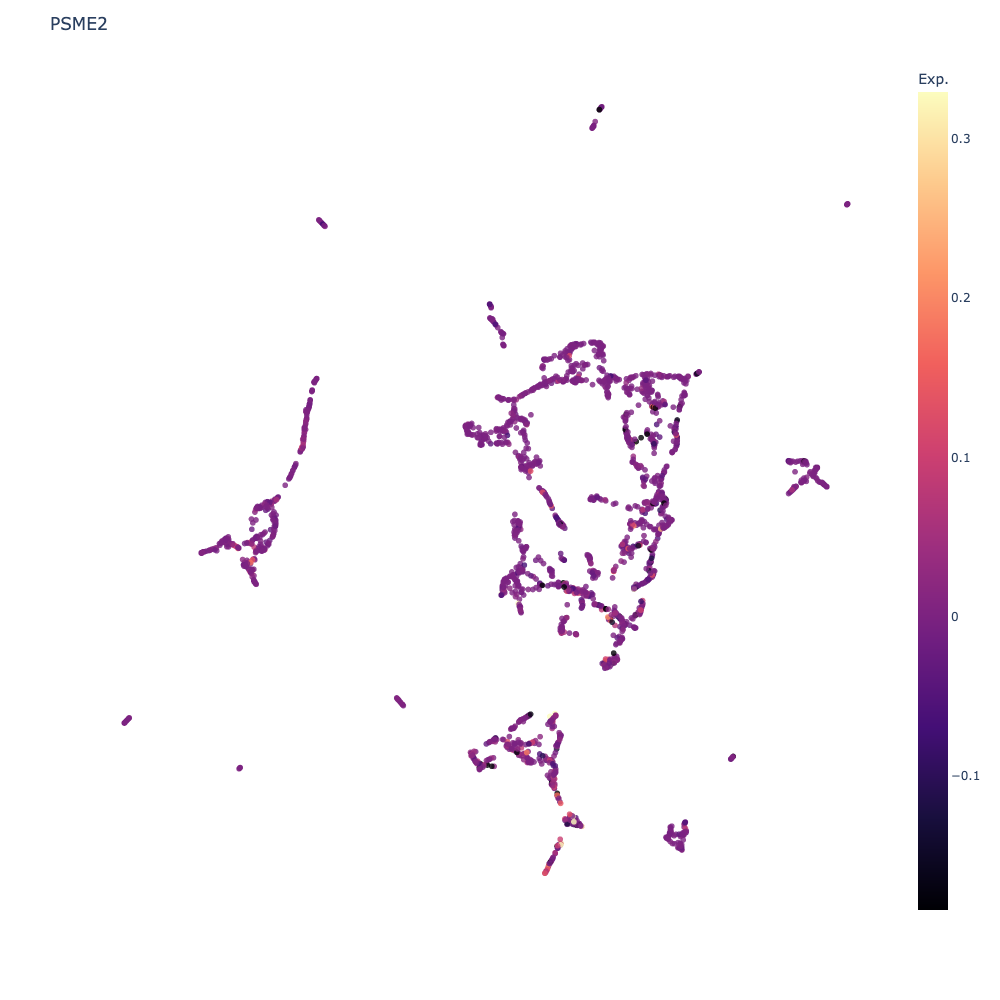
Running STvEA might take a few minutes (fitting a negative binomial model takes longer than a gaussian model). Once the integration is complete, you can color the CODEX data by the expression level of any gene that was mapped from CITE-seq by going to the Other Features tab.

