DE Analysis
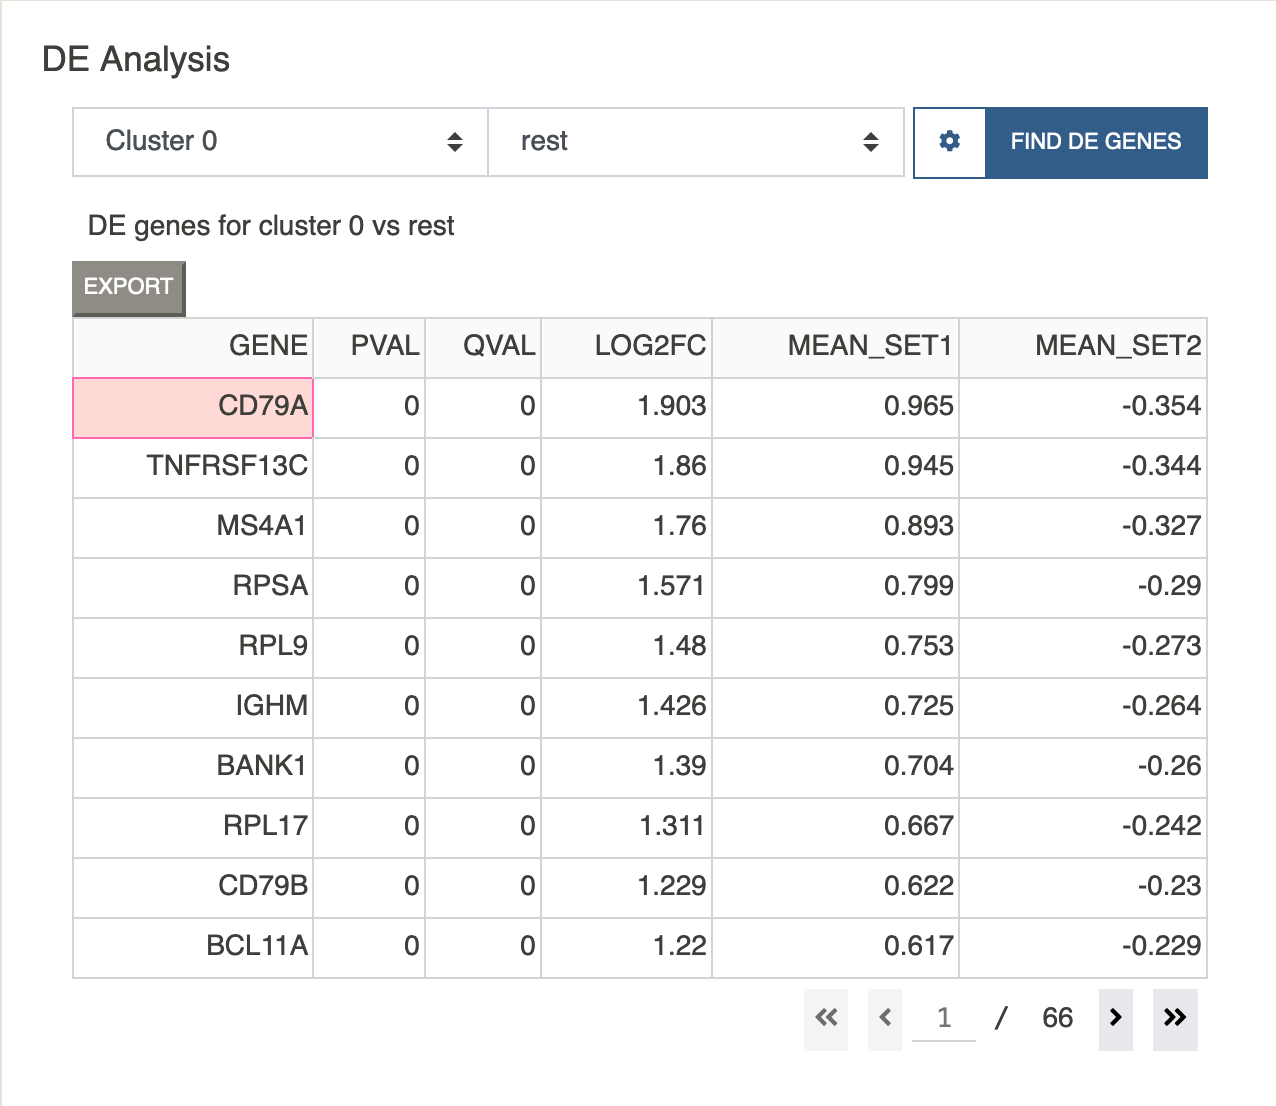
DE analysis can be performed for any cluster or user-defined subset. It is possible to run “one vs all” or “one vs one” tests. If the second subset is set to rest, Cellar will find DE genes for Subset 1 against all the remaining cells. Otherwise, Cellar finds DE genes of Subset 1 vs Subset 2.
To determine DE genes we use a t-test as implemented in the diffxpy package. All DE genes are sorted by log fold-change. The corrected p-value threshold or fold-change threshold can also be specified under the settings popover. If FC is set to 0, then no fold-change filtering is applied. If the data has been log-transformed during the preprocessing step, please make sure “Is Data Logged” has been set to True, and False otherwise.
Clicking on any row of the DE table will paste the corresponding gene into the feature visualization dropdown menu where it can be visualized using one of the different plotting tools.
The DE table also shows the mean of the selected gene for both chosen subsets. NOTE: this mean is computed on the normalized data (if normalization was applied during the preprocessing step), therefore, it may contain negative values. However, the data is scaled back during the computation of fold-change.
