Tutorial - Visualizing CODEX Spatial Tiles
This tutorial describes how to visualize the spatial tile for any CODEX dataset available in Cellar. A related video tutorial can be accessed here. The same pipeline also works for Visium 10x Genomics spatial transcriptomics data. For details on the file format, see Spatial Tile.
We will be analyzing a lymph node dataset, courtesy of the University of Florida and HuBMAP. This dataset can be found on Cellar under the name CODEX_Florida_19-003-lymph-node-R2.
-
Expand the data panel by clicking
Load Dataand select CODEX_Florida_19-003-lymph-node-R2 from the dropdown menu. ClickLoad.
You will note that the plot gets populated automatically. After loading a dataset, Cellar will check if 2D embeddings or cluster assignments are present in the file. In this case, we have already reduced (UMAP + UMAP) and clustered (Leiden) the lymph node dataset. If you wish to recluster or run different dimensionality reduction methods, you can follow the same steps as in the Basic Analysis Pipeline tutorial. We will head straight for the spatial tile.
-
Under the
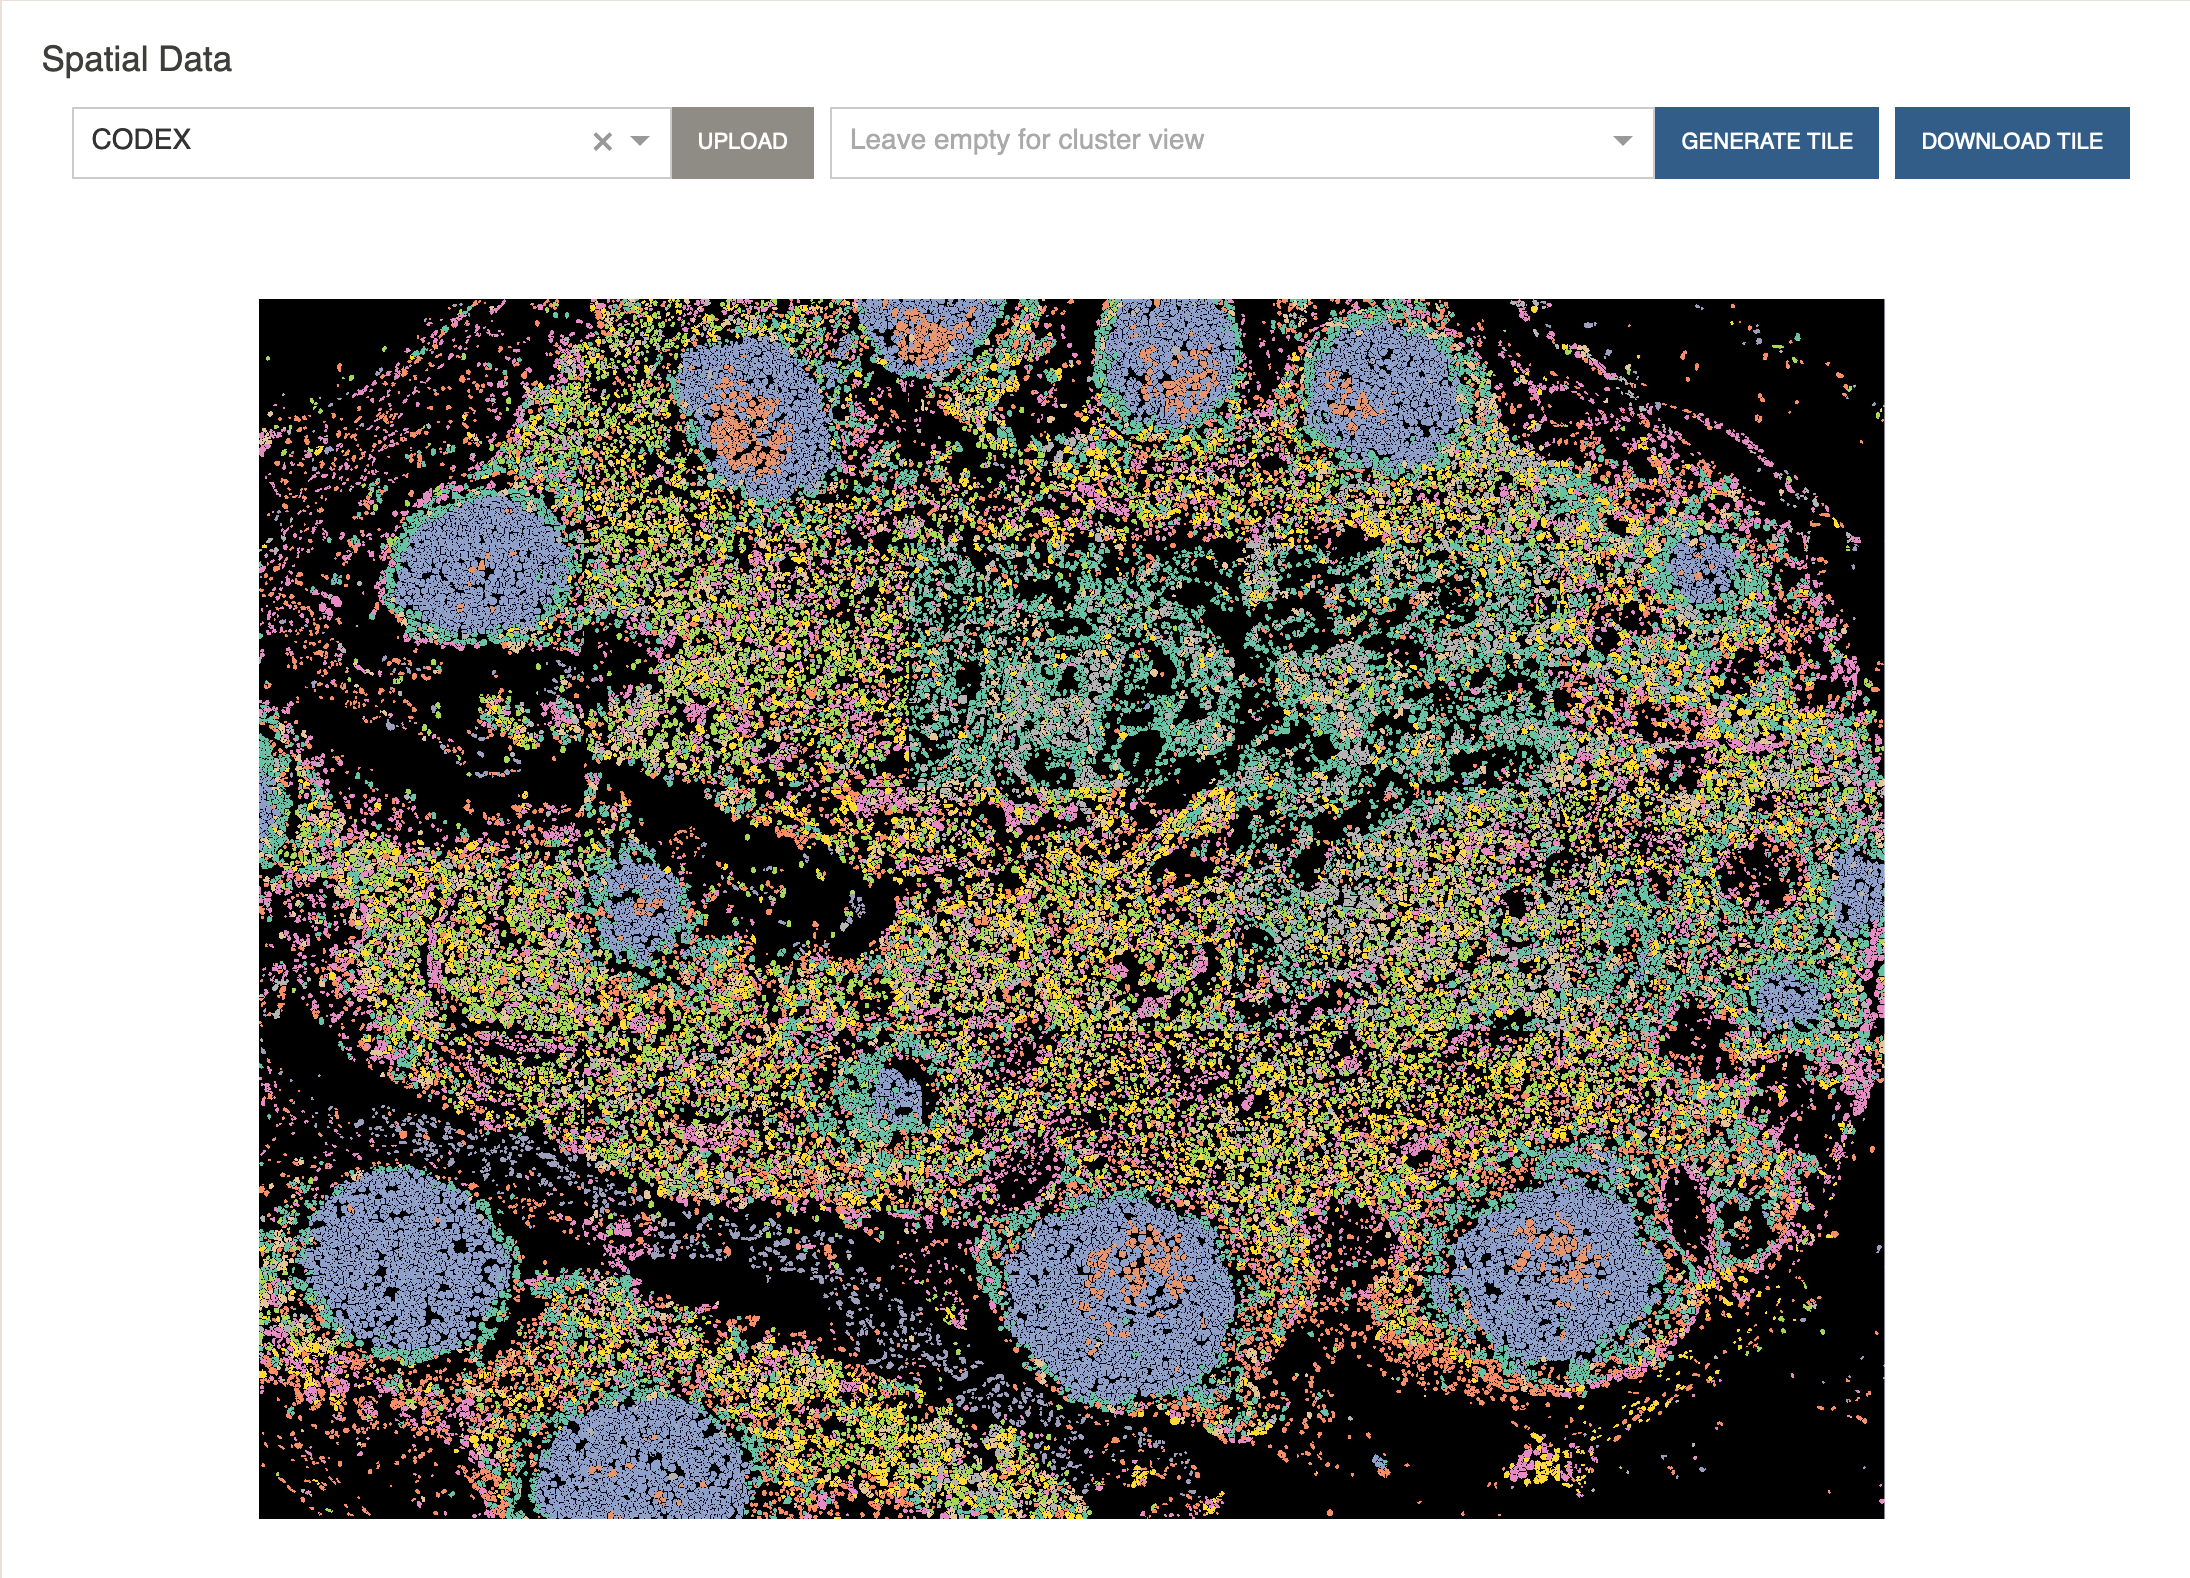
Spatial Datatab, selectCODEXfrom the dropdown menu and clickGenerate Tile.
For your own uploaded CODEX data you may need to upload additional files containing spatial coordinates for every cell. For details, check the section on Spatial Tiles.
Cellar will now read each cell’s coordinates and attempt to color each cell by the cluster assignments.

Hovering over cells will display that cell’s cluster ID.
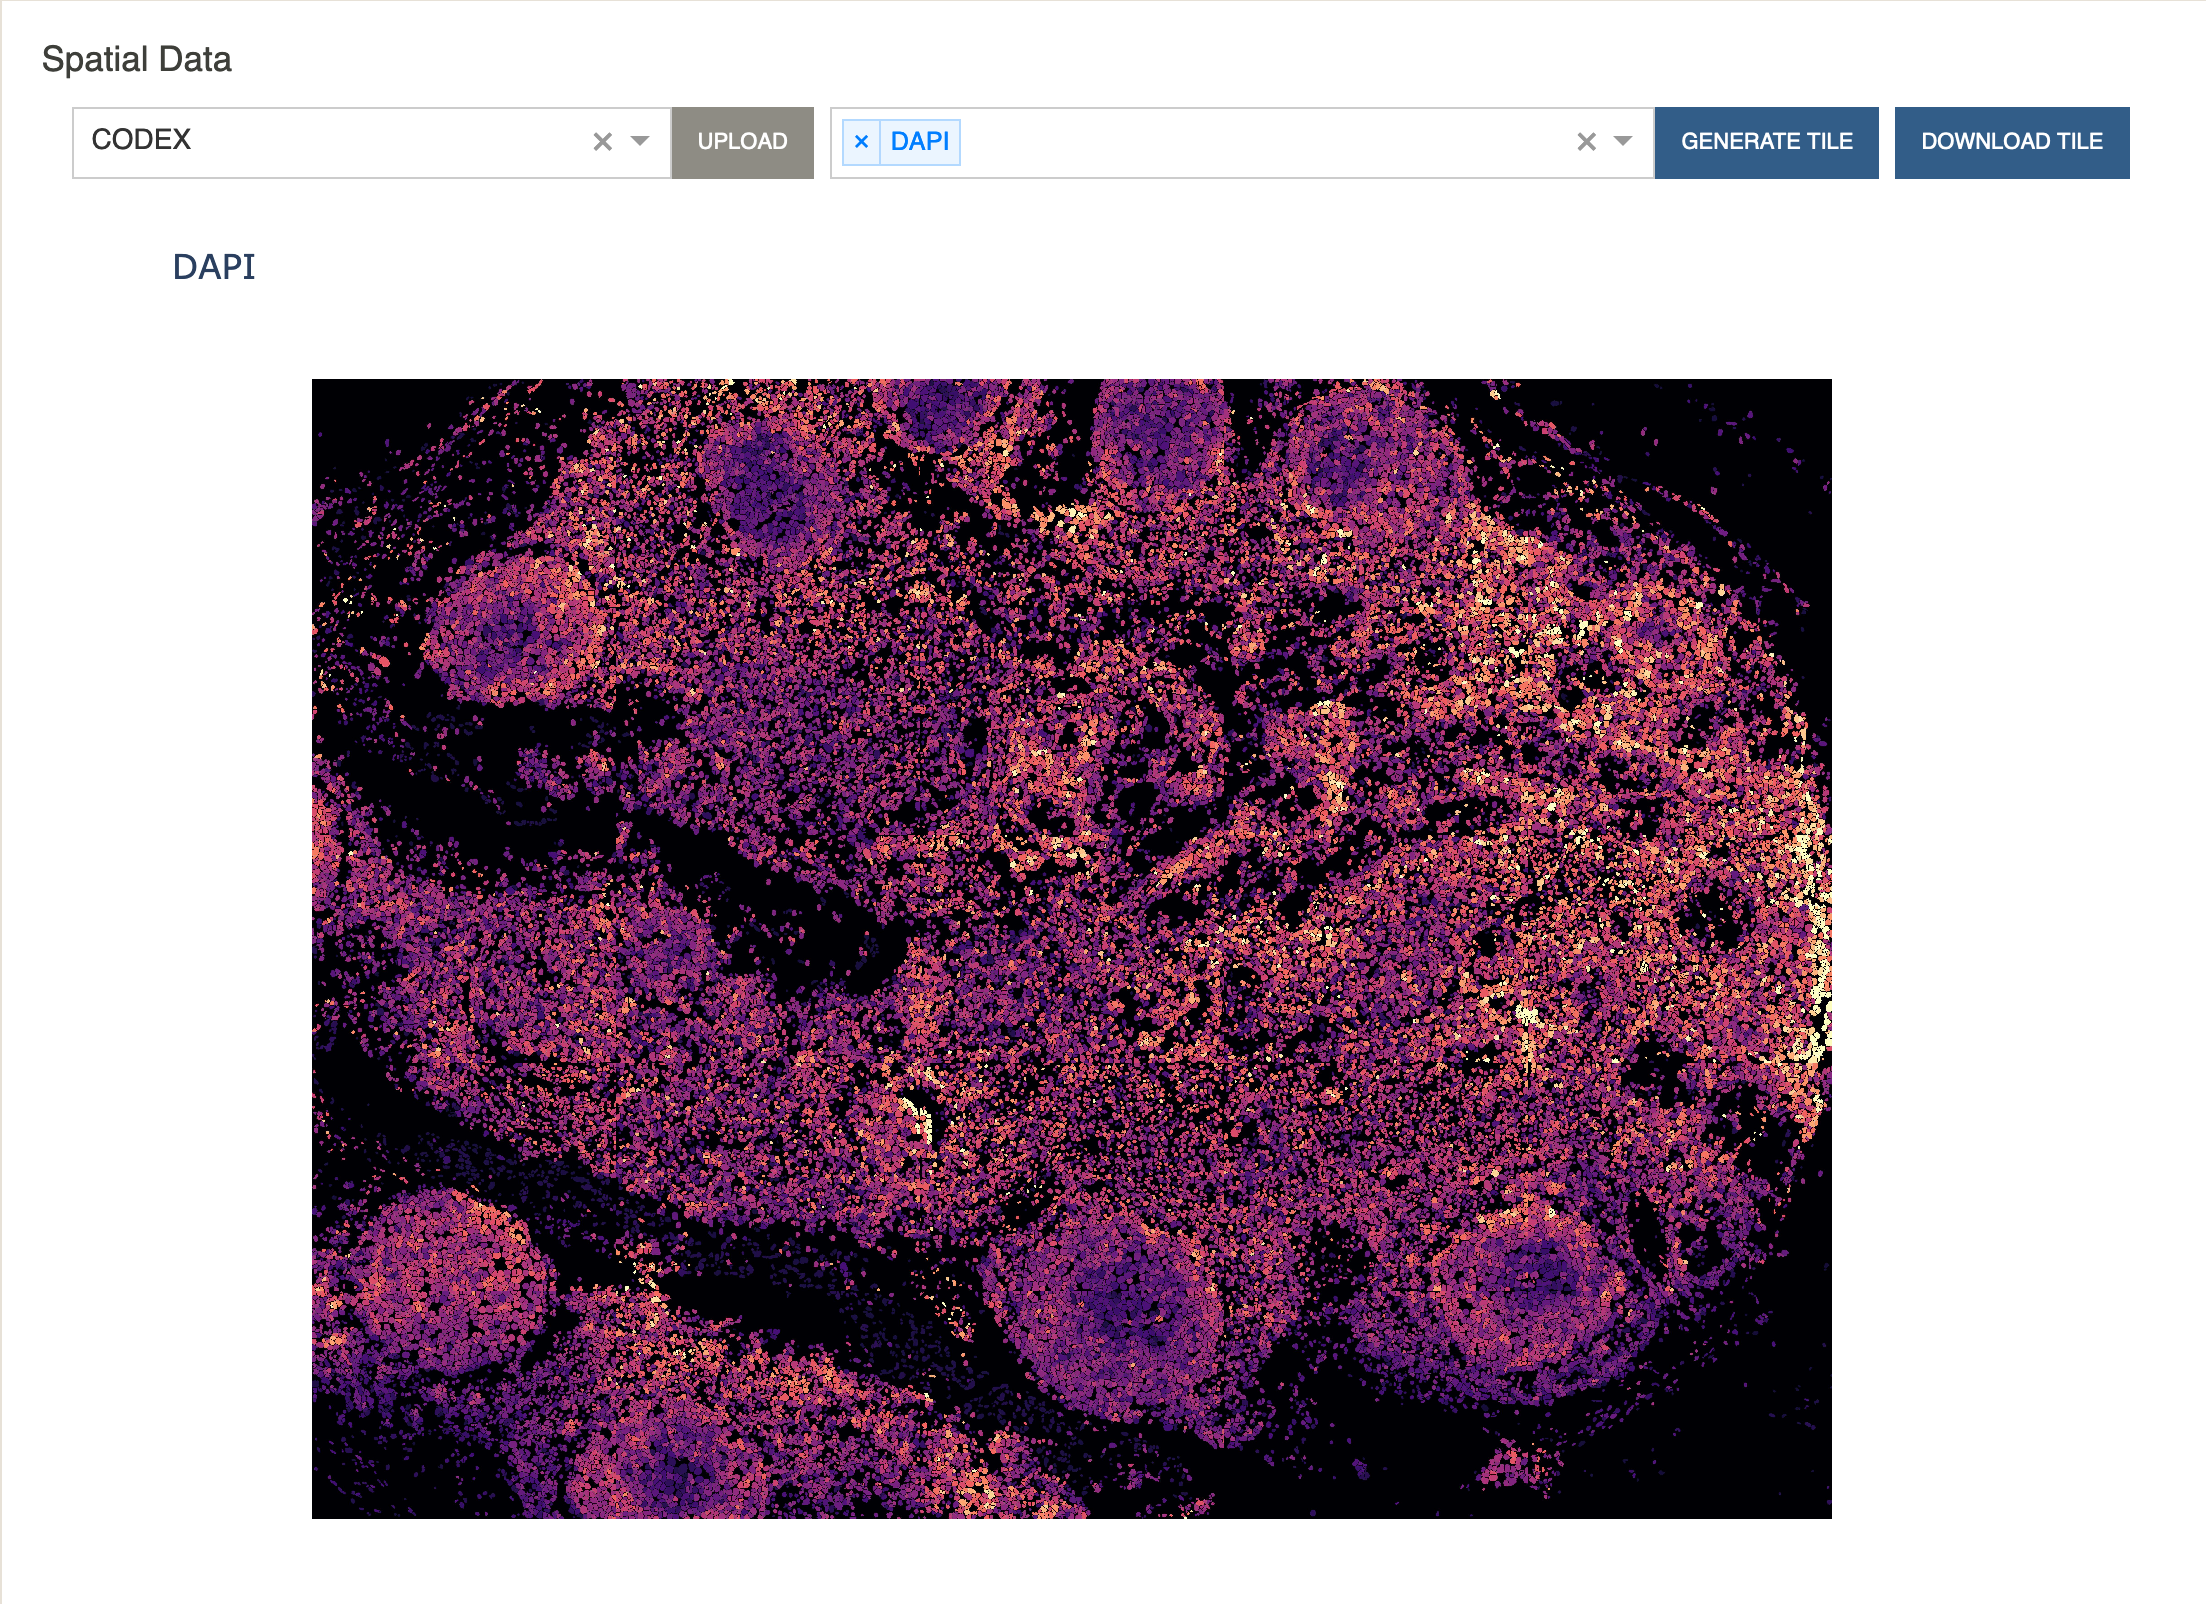
Additionally, you can choose to display the expression levels of a protein.
- Select
DAPIor any protein from the dropdown menu and click “Generate Tile”.

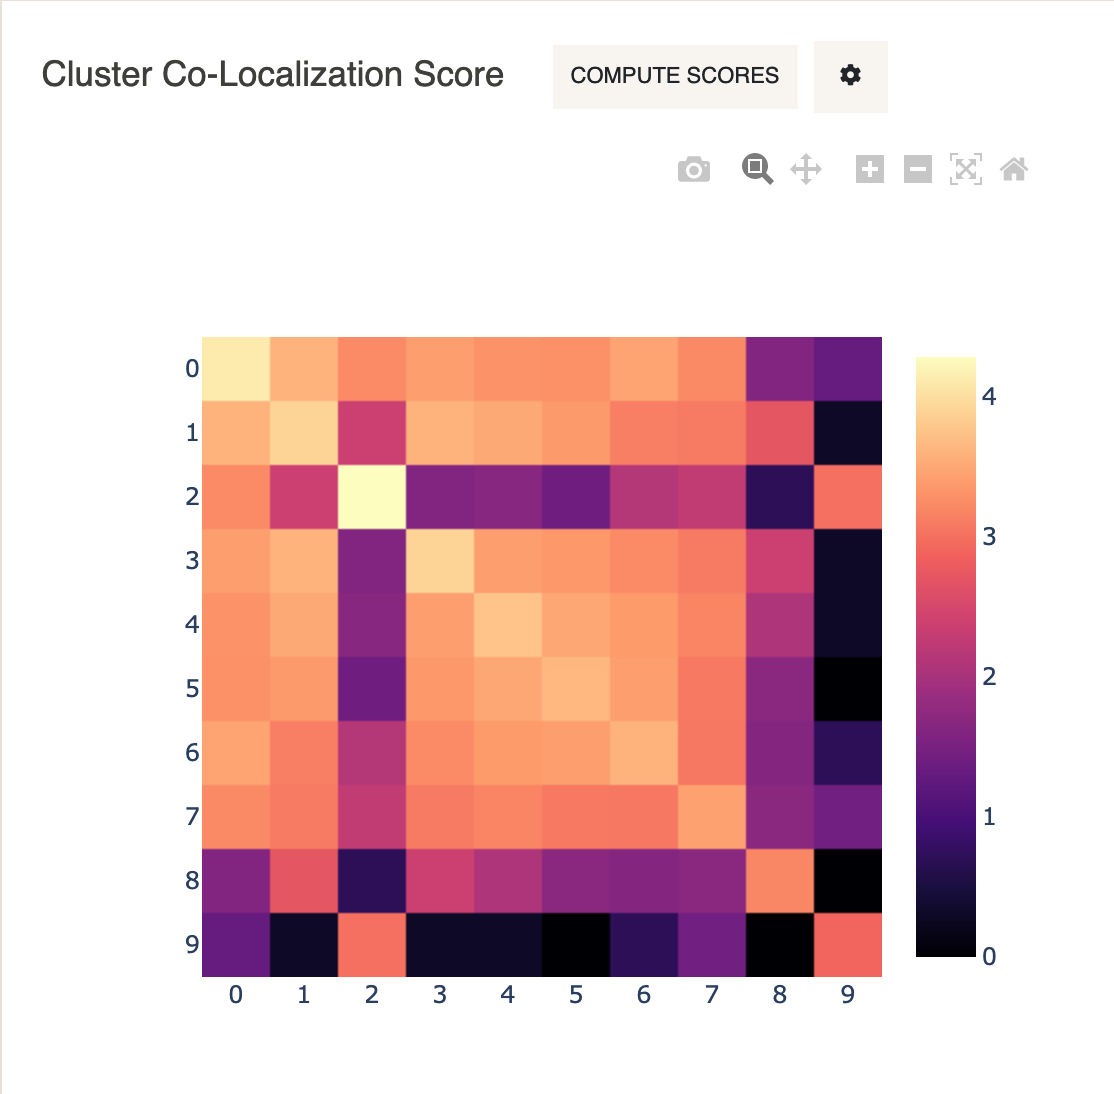
We will also compute cluster co-localization scores to see which clusters are close to each-other in the spatial tile.
- Under
Cluster Co-Localization ScoreclickCompute Scores.

One can notice from this heatmap, for example, that Cluster 2 and Cluster 9 are co-localized. Looking at the spatial tile above, we see that cells belonging to Cluster 9 are indeed surrounded by cells belonging to Cluster 2 (lymphocytes of B lineage).