Spatial Tile
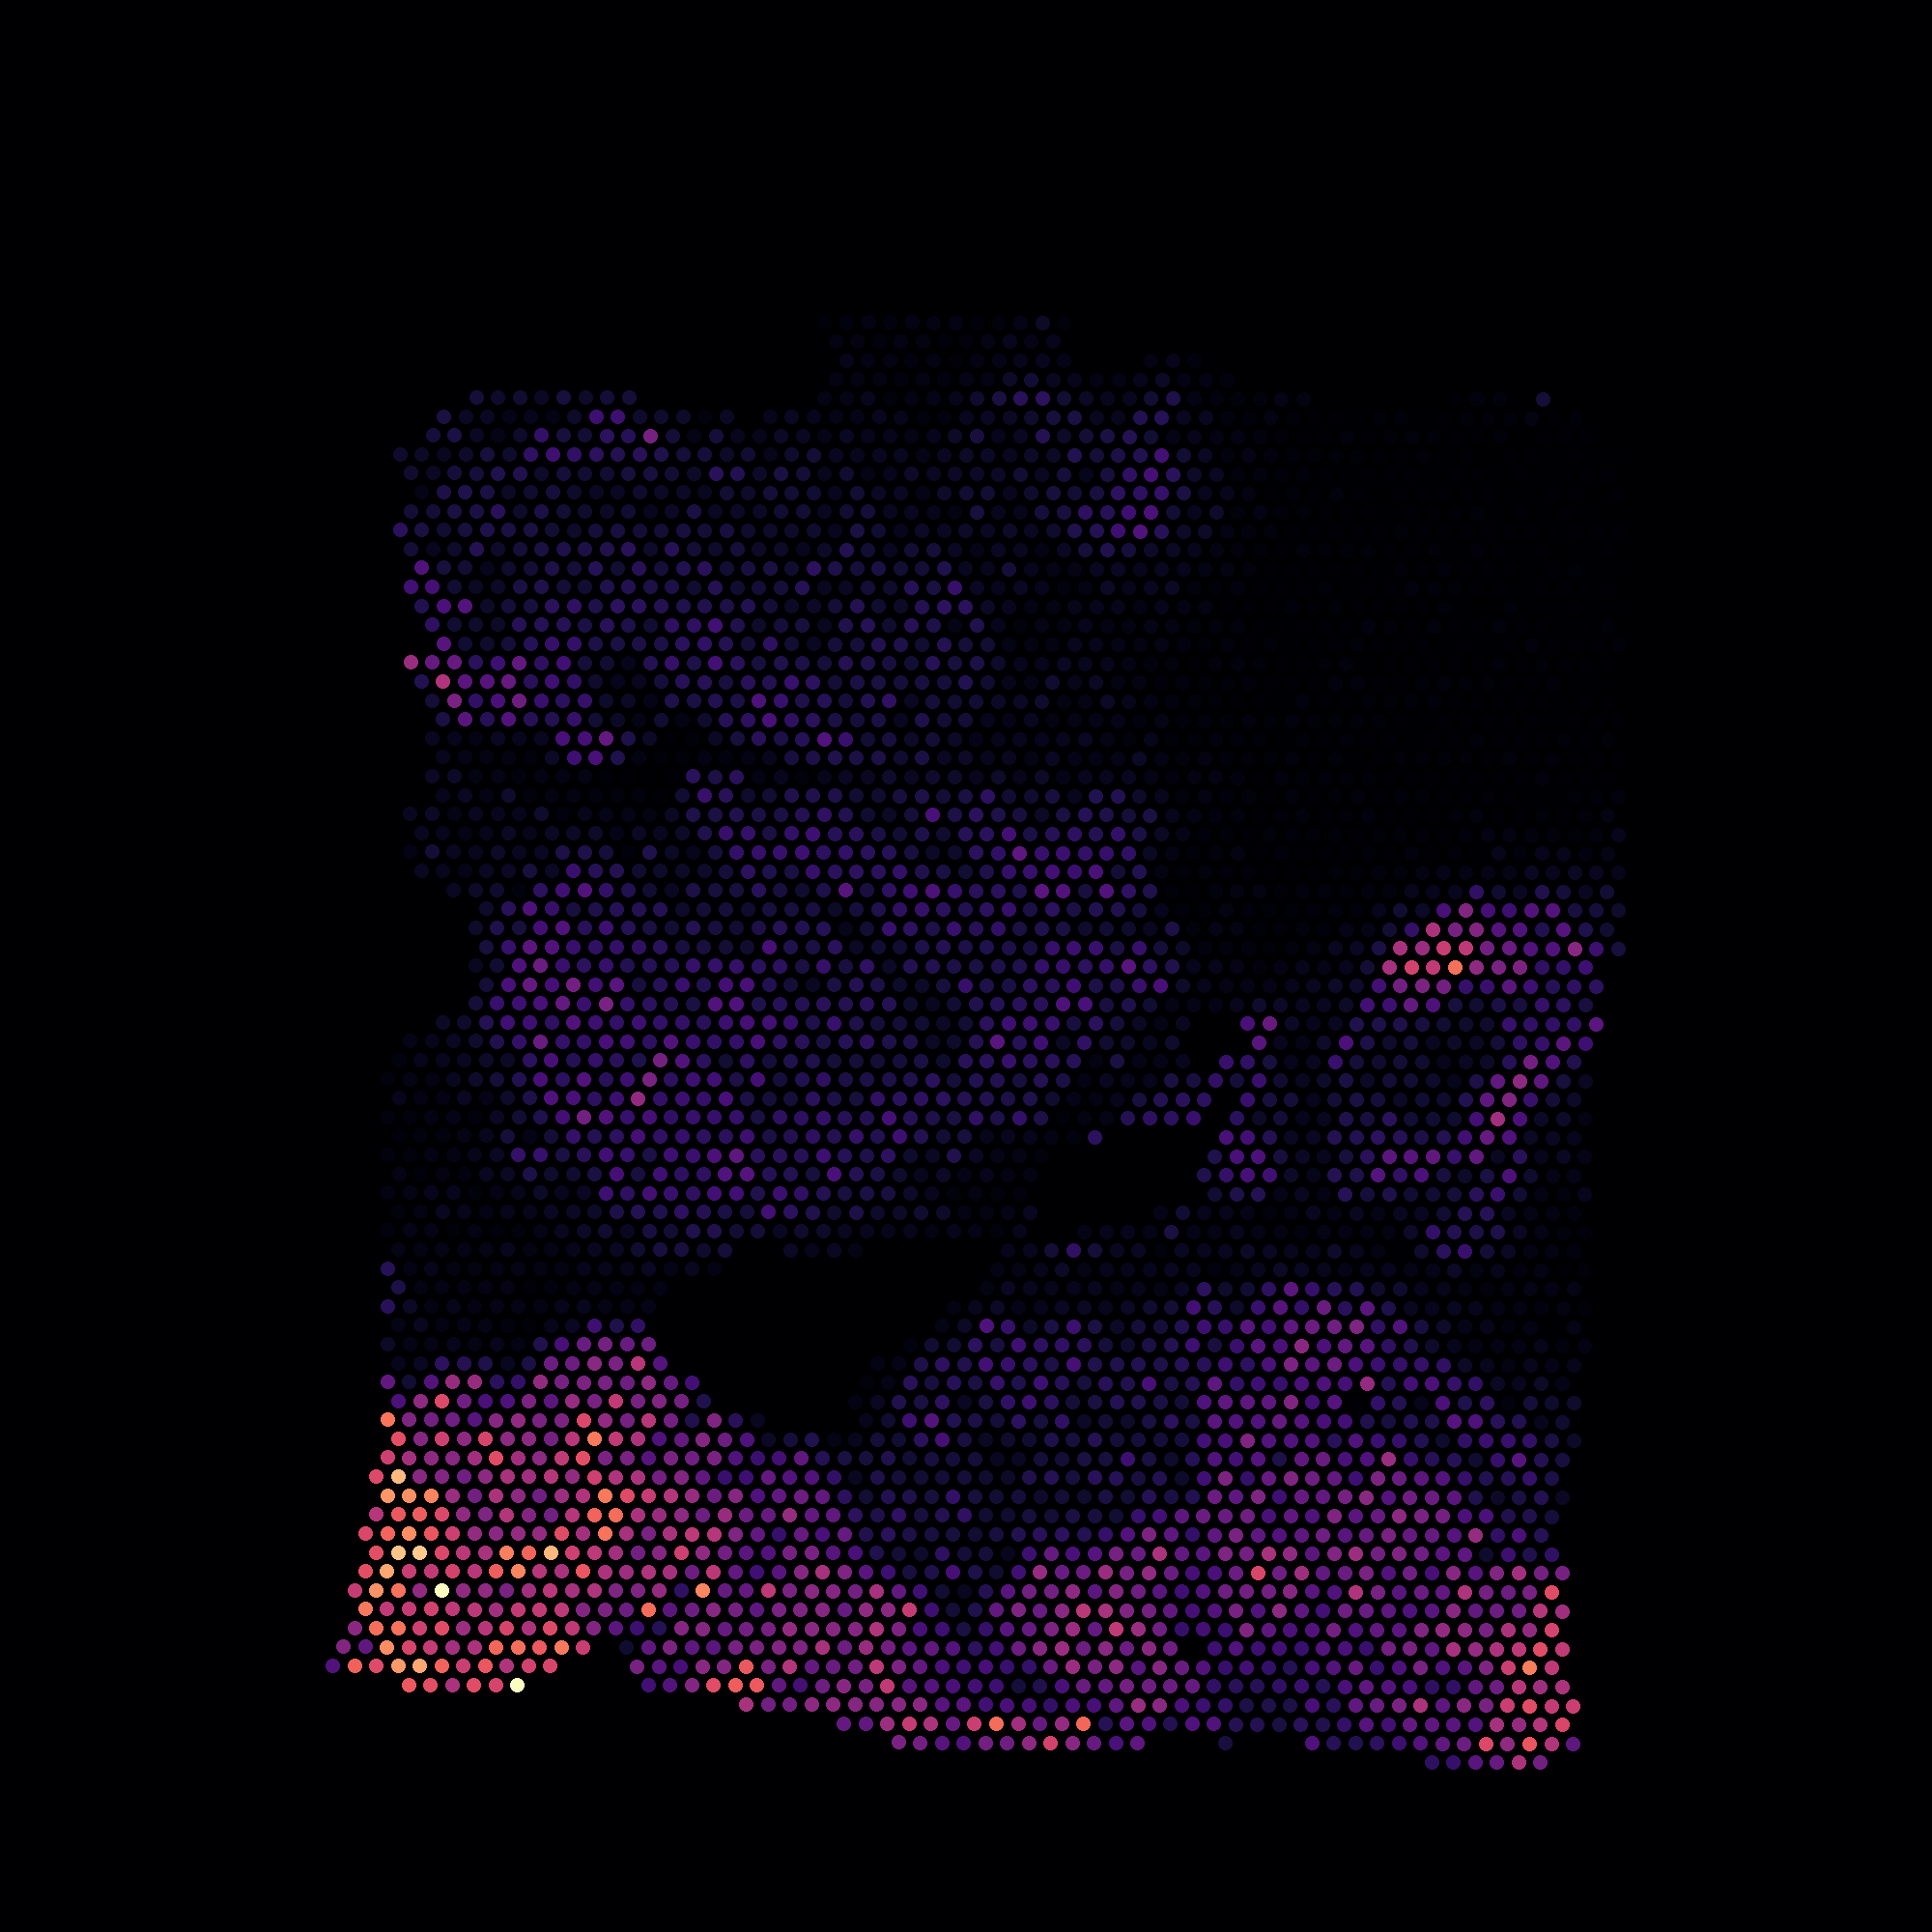
Currently we support CODEX and Visium 10x spatial technologies.
-
CODEX
For CODEX we accept image data in three different ways.
-
x, y coordinates
The simplest representation consists of \(x\) and \(y\) coordinates corresponding to cell centers. This info should be provided in the anndata file under
adata.obs['x']andadata.obs['y']. The cells will be visualized as dots.See an example file.
-
Spatial tile
A single channel image with pixel values representing cell membership can also be provided under
adata.uns['spatial_idx']. The tile can have any shape (width, height). Pixel \((i, j)\) should be set to the index of a cell in adata (from 0 to the number of cells minus 1). A pixel value of -1 implies an empty location, and a value of -2 implies cell boundary (optional). -
cytokit
Lastly, we accept output produced by cytokit. You will need the following:
-
Segmented images
These are
.tiffiles namedR001_X00\*_Y00\*.tifwhere the asterix character specifies the x and y coordinates of the tile (starting from 1). These images should have shape (z-planes, 4, height, width) where the 4 axis show:- the cell segmentations filled,
- nucleus segmentation filled,
- cell segmentation outlines,
- nucleus segmentation outlines
Each pixel in these segmented images will either have value 0, denoting no cell, or the value of the cell ID.
-
A
data.csvfileThis file contains information output from Cytokit. Each row represents a cell, and the column
ridgives the cell index in the.h5adfile. The columnidgives the cell ID for that specific tile. The columnzgives which z-plane in which that particular tile has the best focus, and columns'tile_x'and'tile_y'give the coordinates of the tile for that cell.A folder named
imagescontaining the tiff files and thedata.csvfile need to be compressed into a.tar.gzfile and uploaded to Cellar in the spatial panel.Here is an example
tar.gzfile that corresponds to CODEX_Florida_19-003-lymph-node-R2 in Cellar.
-
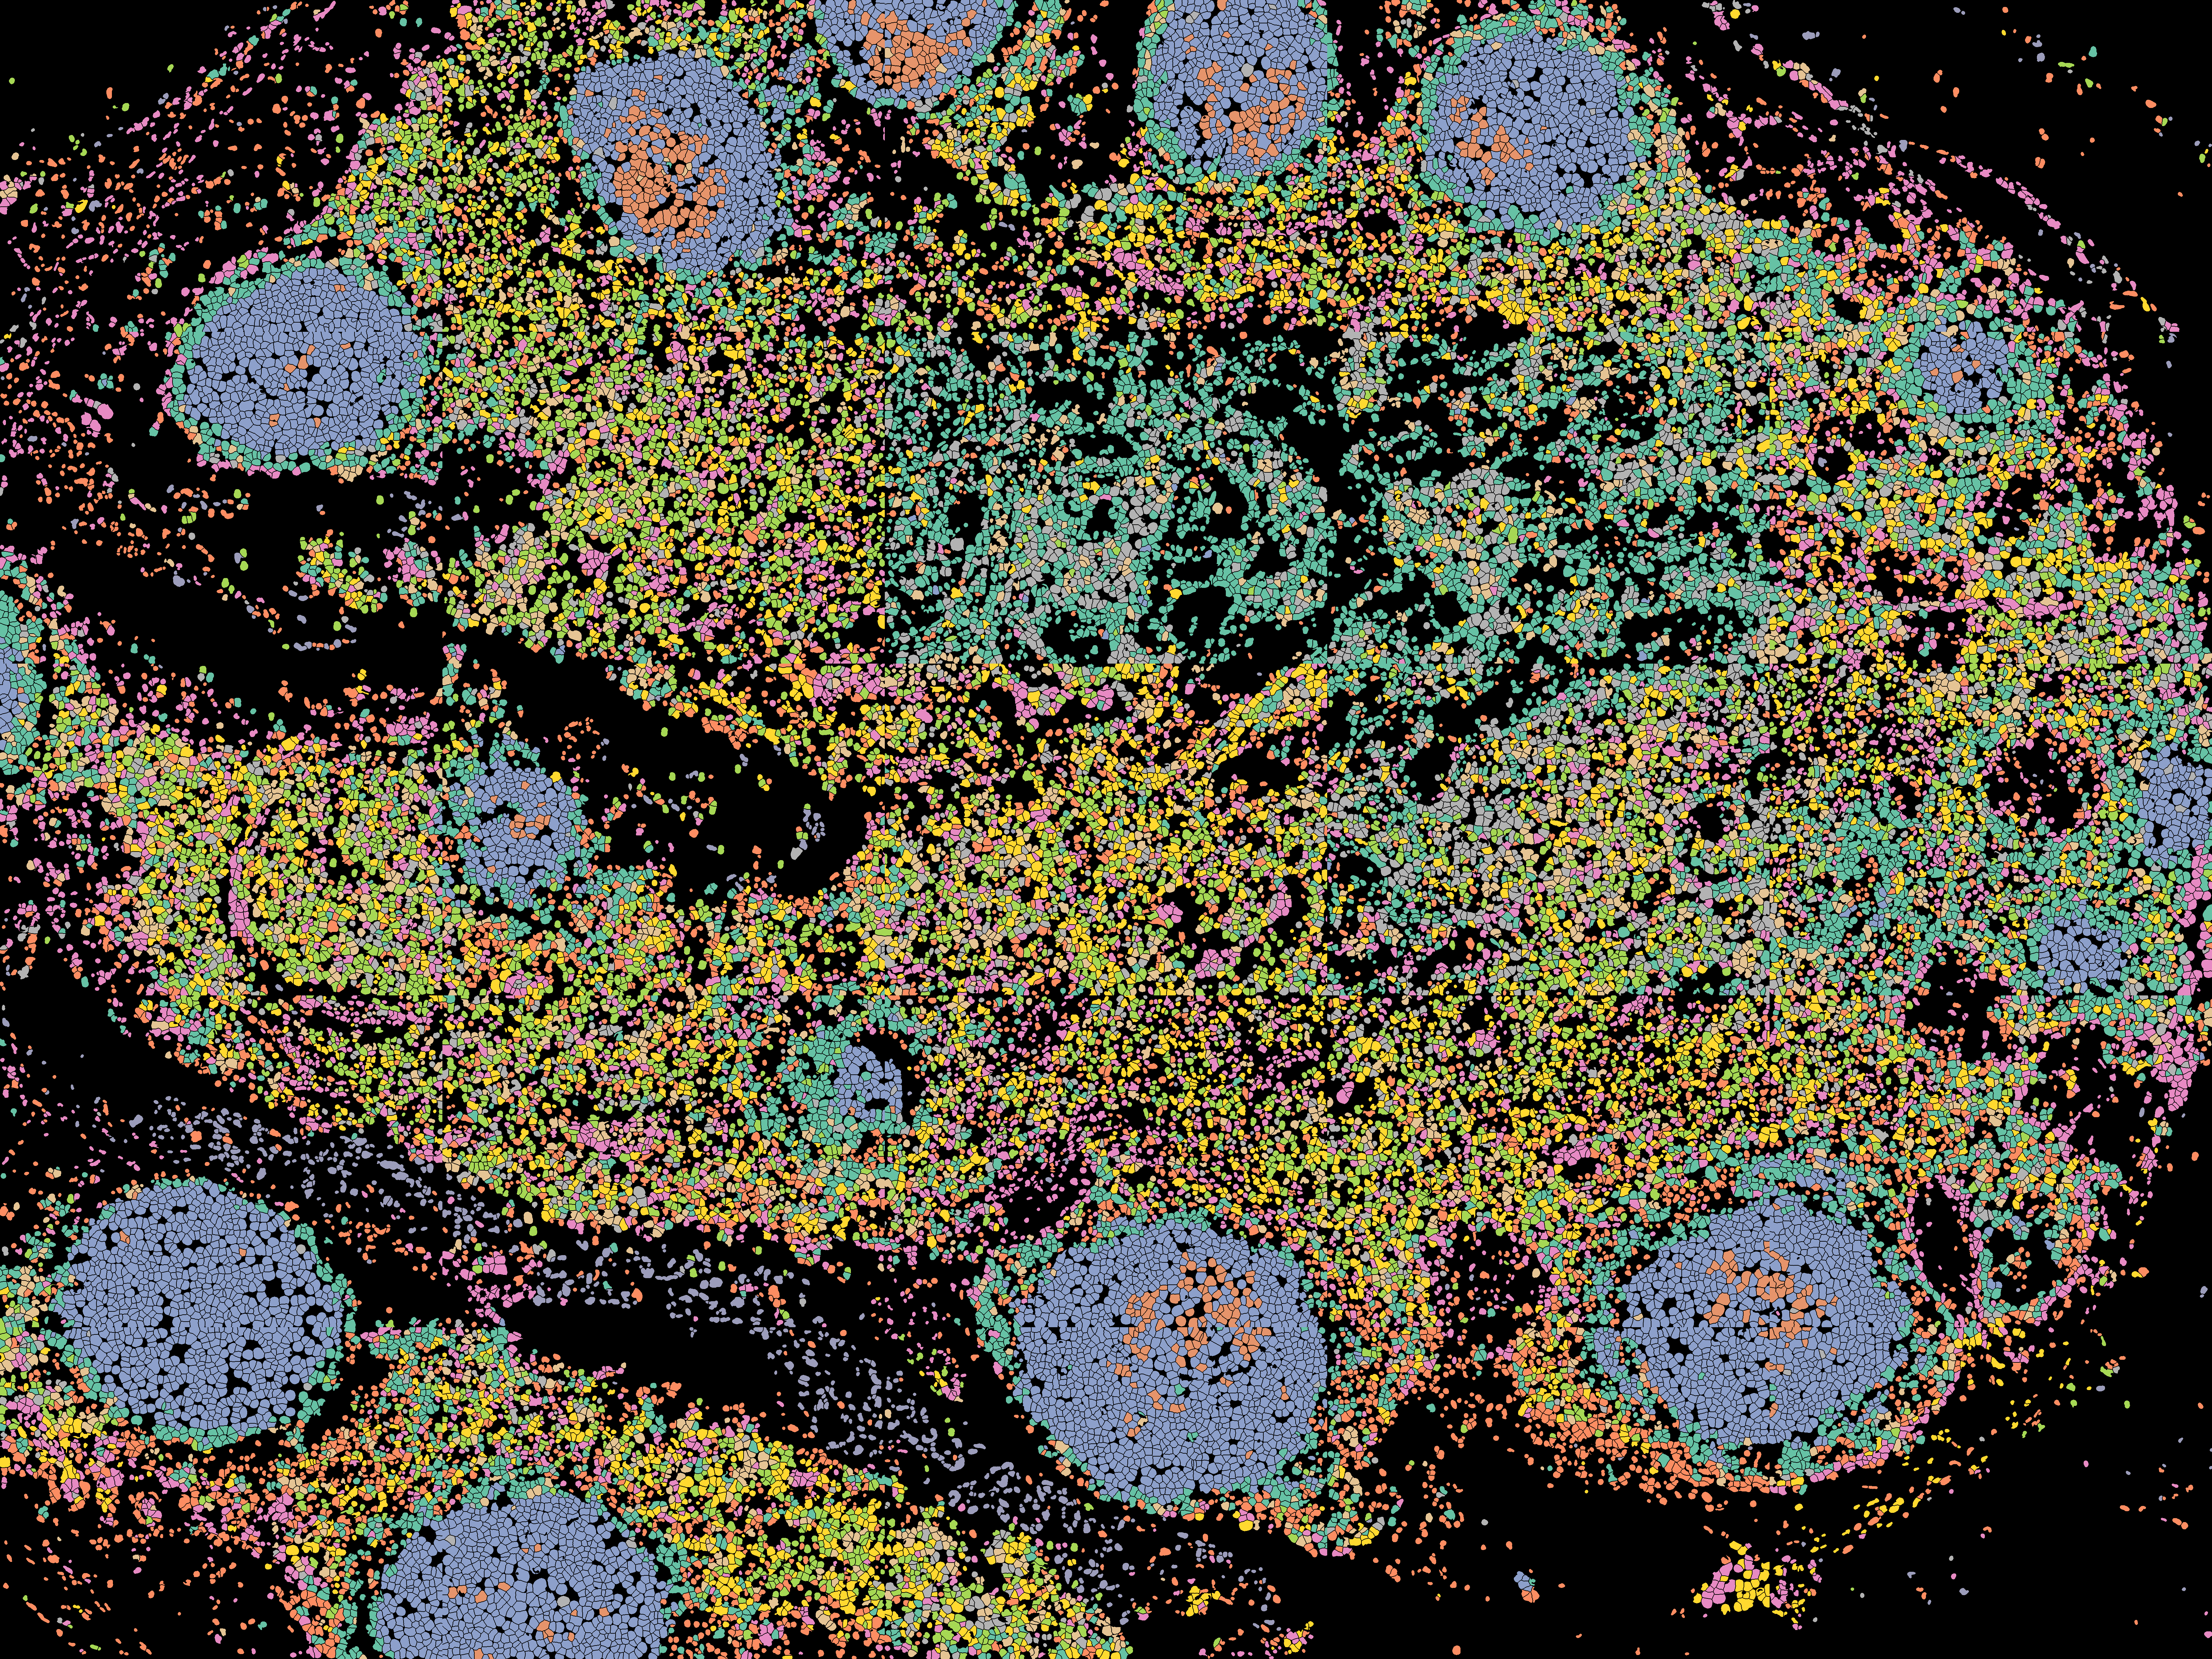
Generating the tile will color each cell by its cluster.
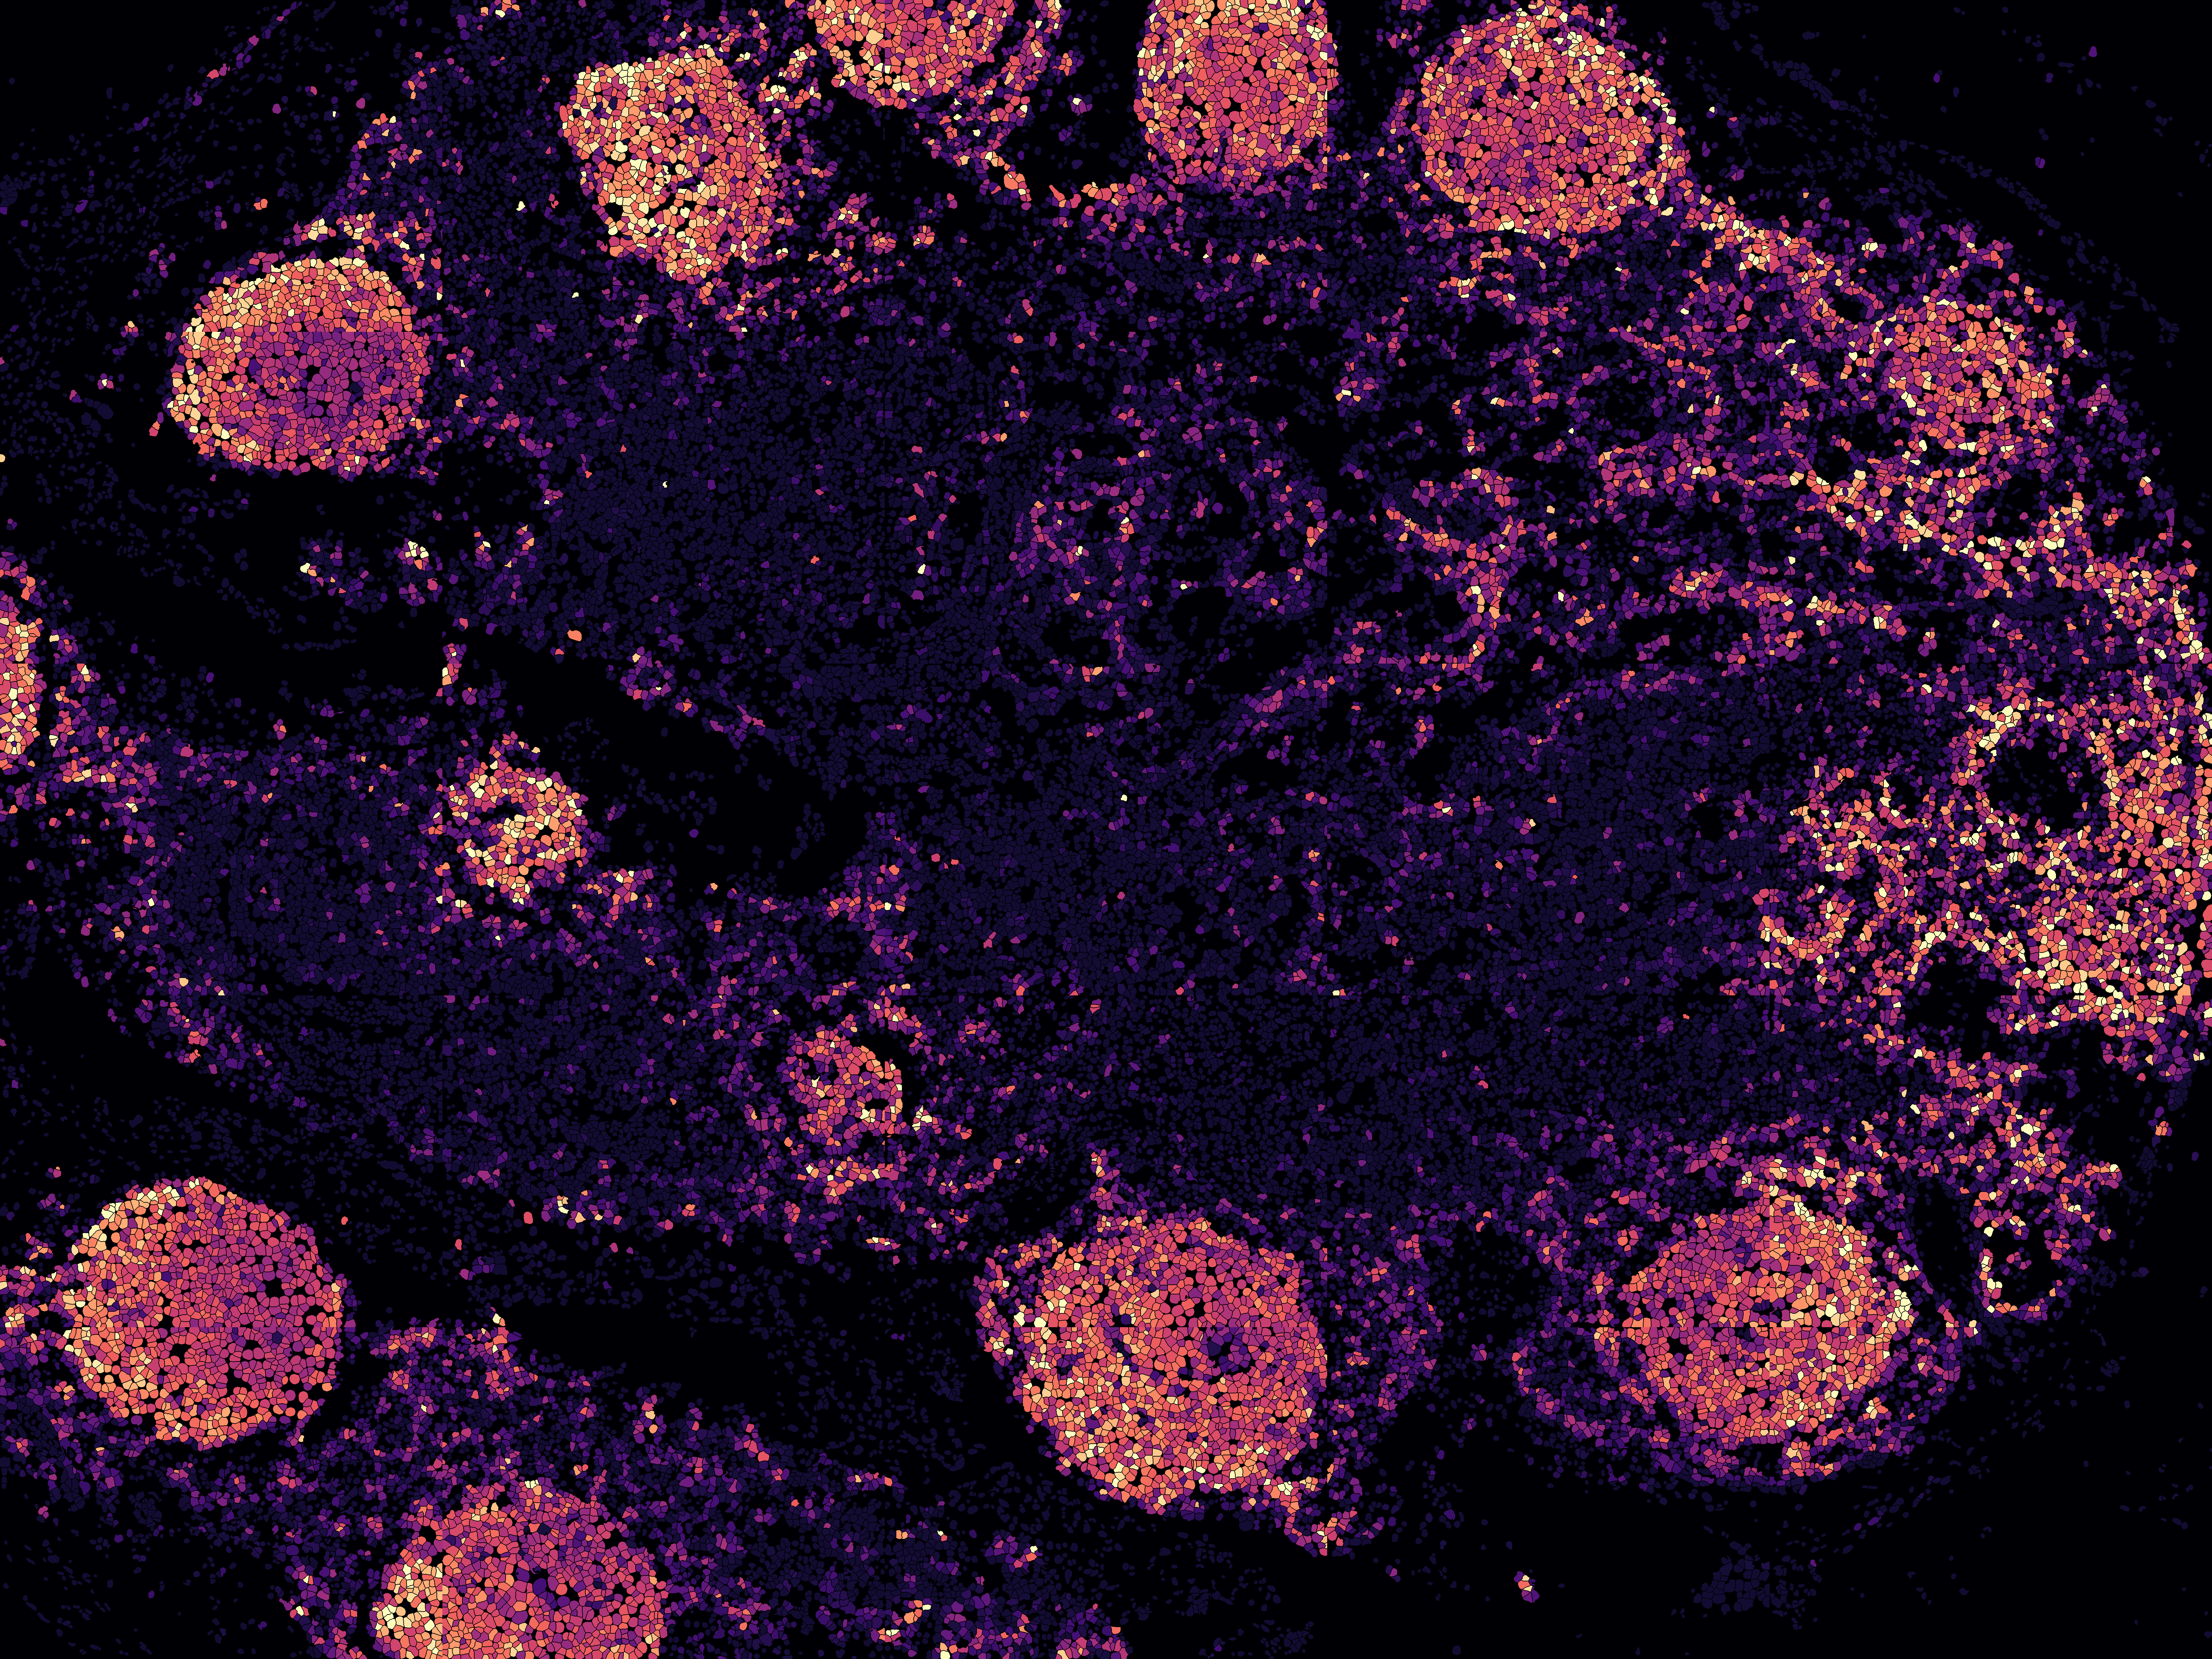
Furthermore, tiles can also be colored by protein expression
-
-
Visium 10x Spatial Transcriptomics
For 10X spatial data, simply upload the spatial related files generated by spaceranger. For example, for this Adult Mouse Brain (FFPE) dataset, download the “Spatial imaging data” and upload it in the
Spatial Datapanel.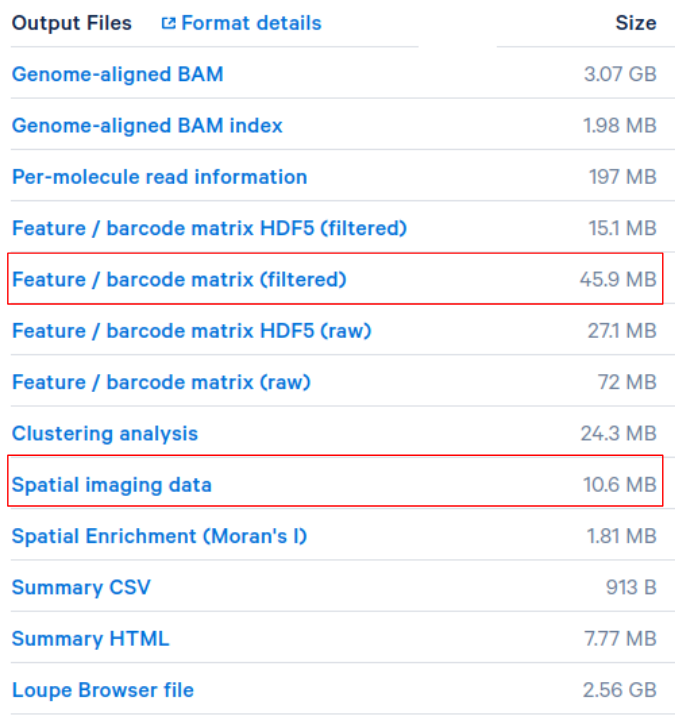
There is no need to upload any spatial image data for the
10x_breast_cancer_w_imagedataset found on our web server.Note that “Feature / barcode matrix (filtered)” gene expression files can be uploaded to Cellar in the
Load Datapanel directly.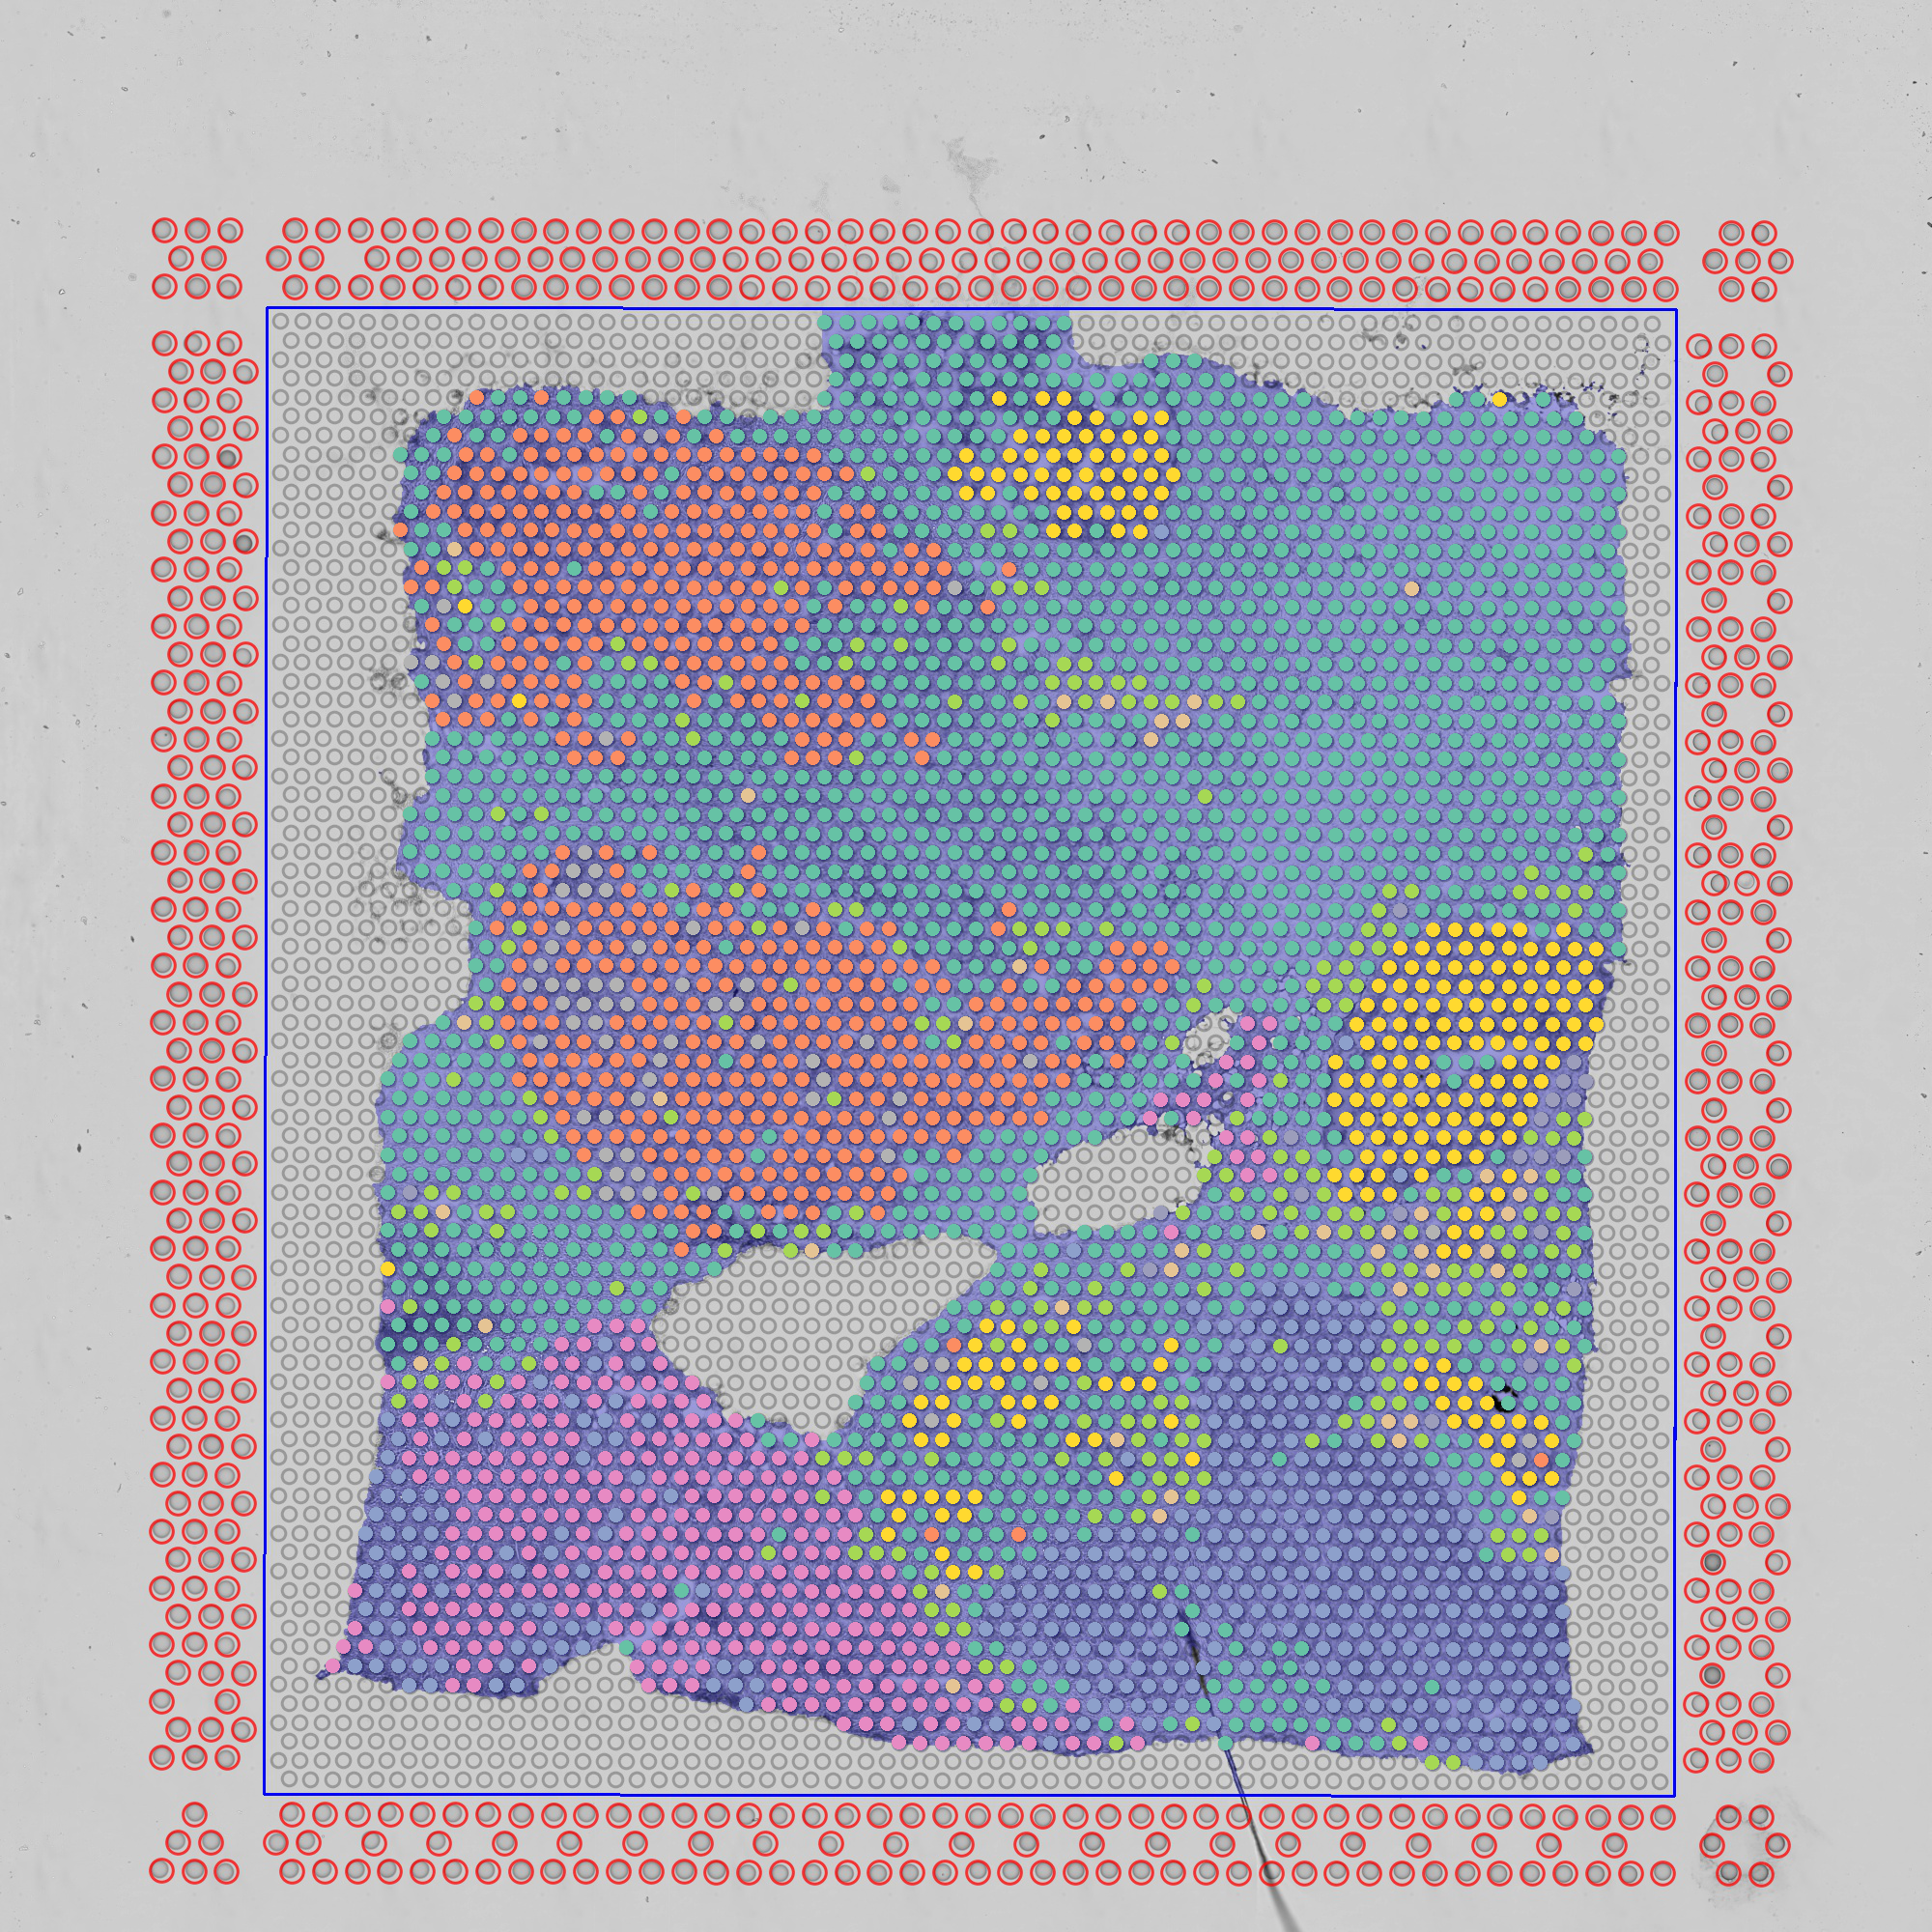
Also colored by gene expression
